Save time with ArcGIS and Python

I usually try to avoid using ArcGIS. As I prefer to do geo-spatial analysis in R, using some great packages including sp, raster and rgdal.

But some recent analyses have required some tendonitis inducing* mouse clicking in ArcGIS. Only a simple task of converting rasters to float files. But none the less, thumb, forefinger and mind numbing after a while.

Here is a basic loop which, will convert all rasters in a folder (inFolder) to floats in a output folder (outFolder). You could potentially use this for many different functions in arcpy.

# Import system modules
import arcpy
from arcpy import env

# Set local variables
inFolder = "T:\\Your_Directory\\Environmental Data\\Bioclim_ascii\\Rasters"
outFolder = "T:\\Your_Directory\\Environmental Data\\Bioclim_ascii\\Float"
arcpy.env.workspace = InFolder

for Ras in arcpy.ListRasters():
    arcpy.RasterToFloat_conversion(inFolder + "\\" + Ras, outFolder + "\\" + Ras + ".flt")

* no tendonitis was developed during this demo.

Posted in Uncategorized | Leave a comment

EWC14 – Match Two: Catenaccio & Ecological Niche Theory.

In football, like science, competing paradigms and co-existing concepts are common. Despite the revolutionary ideas and performances of Sebes and Puskás, other tactical systems flourished in the 1950s and 1960s. The Catenaccio (literally meaning door-bolt in Italian) is a tactical system in football which implies a highly organized, structured and competitive backline defence. The tactic focuses on protecting space to minimise goal-scoring opportunities. Making a team defensively compact, while trying to score goals at the other end.

Italy using Catenaccio to stop Spain.

Italy using Catenaccio to stop Spain.

Parallels can be drawn between the Catenaccio system and Ecological Niche theory. Niche theory was formally defined in 1957, when G. Evelyn Hutchinson defined a niche as an n-dimensional hyper-volume. Where the dimensions are environmental conditions and the resources that define the requirements of an individual or a species.

If we think of a football team as species and a player as an individual, we can start to conceptualise niche in practice. Without a competing team (inter-specific competition), a football team is free to pass the ball and have shots at goal. Really, they are just limited by their own abilities and the confines of a football pitch. This is the Fundamental Niche. However, in a match situation opposing teams (species) and players (individuals) are interacting. They compete for the ball and space. Forcing teams to occupy a smaller space than they would occupy without competition. This is called the Realised Niche.

Two fundamental niches defined by a pair of variables in a two-dimensional niche space. As depicted in Hutchinsons 1957 paper.

Two fundamental niches as depicted in Hutchinson’s 1957 paper.

Catennacio like Niche theory has had plenty of success, for football the Italian club teams of the 60, 70s and 90s and the national team all had success using this tactic, most recently in 2006 where they used an updated version to claim the 2006 world cup final. In ecology, niche theory is alive and well and still remains widely implemented and debated in fields such species distribution modelling and community ecology.

There is a long history in the ecological literature that aims to understand what processes drive interactions between species. One of the most famous in the Lotka-Volterra competition model. The Lotka–Volterra model is a pair of differential equations, used to describe the dynamics of biological systems in which two species interact. If we want explicitly explore this concept, we can think of the famous Lotka-Volterra model in terms of football.

The following equations represent a model of continuous logistic competition between two species. For the purposes of our soccer analogy the equations represent the success of two competing teams.

\Large \frac{d N_{1}}{d t} = r_{1}N_{1}(1-\alpha_{11}N_{1}-\alpha_{12}N_{2})
\Large \frac{d N_{2}}{d t} = r_{2}N_{2}(1-\alpha_{21}N_{2}-\alpha_{21}N_{2})

r_{i} Represents individuals produced per individual per unit time. As we are thinking of this in terms of football, this might be the appearance of new players? However as that doesn’t really make sense in terms of a football match, let’s think of this as number of passes achieved at each time step. A proxy for a teams competitive edge.

\alpha_{ii} 
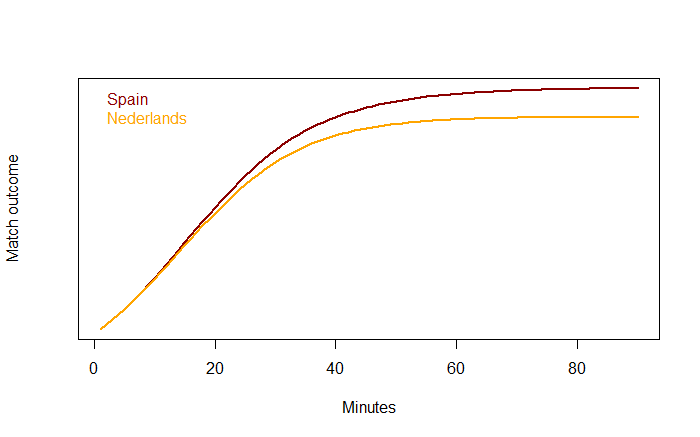
Is the effect of intra-specific competition between individuals of species i on the overall population size. Once again in terms of football this might represent the tempo as game is played at? If the tempo (speed a team plays) is fast, you might expect to out play the opposition. If you play really fast then we might expect teams to get tired, their passing starts to fall apart and eventually you lose due to exhaustion. Additionally, if a team’s tempo is too slow and you lose (Unless you’re the Spanish team, as we’ll discover in the example below).

\alpha_{ij} Is the negative effect of inter-specific competition of species j has on the growth rate of species i or vice versa. For the purposes of my football example, we are going to think of this as pressure from the opposing team.

Now it pains me to revisit the 2010 Football World Cup because of my Dutch heritage. But for the sake of science, I’ll use the 2010 WC final as an example of this model applied to football.  And as we know the result (Spain won), I have fixed the match to enable Spain to win. As you can see in the example figure below.

A Lotka-Volterra model that depicts the outcome of the 2010 EWC final.

A Lotka-Volterra model that depicts the outcome of the 2010 EWC final.


Now if you want to see what are the effects of \alpha_{ii} and \alpha_{ij}  on the outcomes of our 2010 EWC final you can visit this Shiny app I’ve created to see what happens. What happens if you increase the tempo (\alpha_{ii}) and pressure (\alpha_{ij}) Spain exert on the Dutch team? What happens if the Spanish team drank to much Sangria and play terribly? Have a play and see if you can alter the outcome of 2010 Ecological World Cup.

Well that’s it for another week of Ecological World Cup 14. Next week I might try and explore the links between Total Football and Neutral Theory.

And as Alan Partridge would say: “That was liquid football.”

Posted in Uncategorized | 1 Comment

The Ecology Football World Cup. “Match” One: The Golden Team and IBT.

It’s time. Time for what? Time for the World Cup! And to discuss the links between ecology and football. I’m going to write a weekly analogue between a key football tactic and an established ecological theory. Comparison one, the Golden Team and Island Biogeography Theory (IBT).

So let’s go back to the 1950s. The beginning of a football revolution. A few world cups completed and the inventors of the game England, remain trophy less. As Crick and Watson unlock the structure of the DNA molecule. They were watching their own England play the Golden Team in the “Match of the Century”. England, a team almost never beaten on home soil. Versus the Magical Magyars, an Hungarian national football team of the 1950s. The Mighty Magyars won the famed Match of the Century. Ferenc Puskás, Sándor Kocsis and their coach Gusztáv Sebes changed football for the better. Sebes energised his players to be versatile. Driving his players to shift position across the field. Moving his team away from established tactics of fixed positions and deterministic roles.

Puskas - The Nucleolus of the Golden Team.

Puskas – The Nucleolus of the Golden Team.

In ecology, Island Biogeography Theory was also a game changer. The idea of IBT kicked off in the 1960s by Robert MacArthur and E.O. Wilson. IBT states immigration and extinction influences species richness on undisturbed islands. Distance of islands drives immigration rate.  Islands that are further away from a source population are less likely to receive colonisers. Larger islands are likely to have more species. This is due to large island have more diverse habitats that minimise local extinction.

IBT

Equilibrium Model form MacArthur and Wilson (1967)

If we think of species numbers as goals.  Players as islands. The football pitch as a network of islands. And scoring goals as species immigration and conceding goals as extinction. A player is more likely to score a goal if they receive good passes from their team mates. This is analogous to the IBT idea of an islands getting more species if they are close to a source population. Players in space maintain possession of the ball, and in turn, they are less likely to lose the ball and concede goals. As in IBT, more spacious islands support more species.

So that’s analogy one completed. A simple one to start. But as we can see, early developments in football tactics suggest that space and connectivity are important for goals. The same is true for diversity.

Next match: Catenaccio and Niche Theory. Stay tuned.

Posted in Uncategorized | Tagged , , , , , , | Leave a comment

It’s been a while

In all news Skip’s research. I’ve got a lot of blogging to catch up on. A few post to come on upcoming adventures to US and Canada.

Cool R trick and tips with Knitr, creating R Packages to make your work flow much more efficiently and a pretty handy little code checking tool.

I found this little gem the other day, made me laugh.

seashell

Posted in Uncategorized | 1 Comment

Read and listen.

A Spectrogram of music. The colour intensity is logarithmic!

I’m one of those people that loves to listen to music while working and reading. So here are a few papers I’m enjoying along with some tracks to accompany them.

A classic paper (May, 1976) deserves a classic tune. There is some challenging maths. But I have this (unrealistic but awesome) image of Lord Robert May bopping to Blue Oyster Cult and (Don’t fear) The Reaper and doing some differential equations.

I also like this paper by Olivero et al 2012 (Olivero et al., 2012), this is a good methods paper that provides some interesting insights to defining biogeographic regions. Being a methods paper you sometimes feel like you can hardly keep you head above water, but these tracks should help you swim.

A main part of my PhD is trying to describe drivers of deep-sea biodiversity at oceanic and global scales. This paper looks at the temporal variability in ocean productivity (Behrenfeld et al., 2006). One it’s an interesting paper, but two, temporal variability should be explored when looking at predictors of biodiversity. Here is a classic Thelonious Monk album which is well known for its treacherous tempo changes. If you’re not a Jazz fan, maybe pop is more your thang

And finally,  Belanger et al (2012) predict global biogeographic structure for shallow marine environments. An interesting paper that compares existing qualitative bioregionalisation to models built on correlations between species occurrence data and environmental predictors. Not surprisingly temperature came out on top.

Until next time,

Skip.

Behrenfeld, M.J., O’Malley, R.T., Siegel, D.A., McClain, C.R., Sarmiento, J.L., Feldman, G.C., Milligan, A.J., Falkowski, P.G., Letelier, R.M. & Boss, E.S. (2006) Climate-driven trends in contemporary ocean productivity. Nature, 444, 752-755.

Belanger, C.L., Jablonski, D., Roy, K., Berke, S.K., Krug, A.Z. & Valentine, J.W. (2012) Global environmental predictors of benthic marine biogeographic structure. Proceedings of the National Academy of Sciences, 109, 14046-14051.

May, R.M. (1976) Simple mathematical models with very complicated dynamics. Nature, 261, 459-467.

Olivero, J., Márquez, A.L. & Real, R. (2012) Integrating Fuzzy Logic and Statistics to Improve the Reliable Delimitation of Biogeographic Regions and Transition Zones. Systematic Biology,

Posted in Uncategorized | 1 Comment

Ten “crack that paper” commandments

Biggie

Ten commandments so you can publish during your PhD,an ode to Pia Lentini and The Notorious B.I.G. Over the weekend I was trying to write up my first PhD chapter as a paper, when The Notorious B.I.G got shuffled into my playlist. It’s been 20 years since Biggie released ‘Ready to die’. This got me thinking about a talk a Post Doc in QAECO lab gave on publishing during your PhD. So I decided to procrastinate from the task at hand and write an ode to Pia and Biggie Smalls. I give you the:

Ten “Crack That Paper” Commandments (play this track and recite the commandments with me!)

I been in this game for a year, doing it for me love of animals
There’s rules so you don’t publish shit, I wrote me a manual
A step by step booklet for you to get
Your game on track, not your wig pushed back

Rule nombre uno: never start the show
without, a plan ready to unfold, modify as you go.
The calendar decreed planning specially
If your times backed up, head down bum up

Number two: never not let em (supervisors) know your next move
Don’t you know em bad boys remain in silence
Take it from your highness (uh-huh)
You need to squeeze them chaps, ask them for their tricks and tips.

Number three: do tasks mu-tip-ly
If your draft is receiving feedback, don’t put your feet up
Ramp your analysis up, or even do a quick graph
Start thinkin’ about your next chapter and get a step up

Number four: know you heard this before
Never deny your timeline supply (Be realistic with your timelines ~3 Drafts per paper)

Number five: Ignore superiors comments is a liability
I don’t care if they’re a nonce, snub remarks and your paper will bounce

Number six: that first draft edit, dead it
You think a lab-head writing your manuscript, shit forget it

Seven: this rule is so underrated
Pitch your paper and ideas to a journal list updated
Methods and “Nature” don’t mix like no fingers and an itch
The wrong pitch and you’re in serious shit

Number eight: never keep no hate in you
Them cats that review your paper get knocked back too

Number nine shoulda been number one to me
If you ain’t kickin’ goals and your paper is rejected by the journal police
If reviews think your works decent by ain’t glisten
Just remember chance plays a role, there is no need to be frettin’

Number ten: a strong word called consignment
Strictly for all men, not just the best men
If you ain’t put in the hours they’ll say “hell no
Cause they gonna want that paper as pure as the drive snow

Follow these rules you’ll have mad papers to post up
If so, all the way to the top
Slug out your paper, watch your thesis stand up
Marker read your papers, they’ll say this is too good to pass up

Hopefully Pia will provide an updated link to her of slides. But in the mean time here are some useful links to look at when thinking about publishing your work: Joern Fischer’s writing blog: http://writingajournalarticle.wordpress.com/
and Corey Bradshaw’s: http://conservationbytes.com/2012/10/22/how-to-write-a-scientific-paper/.

Cheers Skip.

And if you haven’t heard the original here it is! (Apologies to Biggie, hopefully he doesn’t roll over in his grave).

Posted in Uncategorized | 1 Comment

Conference Presentation at 13th International Deep-sea Biodiversity Symposium

I’m speaking next Monday the 3rd of December at the 13th International Deep-sea Biodiversity Symposium in Wellington, New Zealand.

I’ll be speaking on beta-diversity in the deep-sea. My talk will focus on briefly describing the bathyal environment around Australia and New Zealand, the methodological approach I’ve used to create maps of beta-diversity based on presence-only records and I will attempt to test the hypothesis does deep-sea biogeographical patterns resemble those seen in shallow marine environments.

If you can’t make it to Wellington and are keen to have a look at a few of my maps and slides they are available for your viewing pleasure.

Posted in Uncategorized | Leave a comment

R is driving me loopy! – A brief blog on loops in R.

The etymology of R can be traced back to mean a few things… R could have originated from: “AARRRRR!!!” Damn you R I hate you R you and your apostrophes in the wrong place. Or “Aaaaaaa” I’m not sure how I achieved that result? But, I’m a little chuffed by my nifty bit of code work.

I’ve getting a few more Aaaaaa’s than ARARRARRRR’s of late so I thought it’d be good to pass on some of my wisdom. One great part of any computer language is the ability to batch tasks that would normally involve a brain numbing amount of mouse clicking of command prompt typing.

In R there are a number of ways to get a loop going.

The most basic loop can be achieved using for:

for (i in 1:10)
{ mat=matrix(c(i,i))
print(mat)
}

The above loop will produce a two column matrix that contains the values one to ten for increasing with each row.

If you wanted you could turn the above loop into a function. That’s right! You can easily create your own functions in R.

Matrix.Gen <- function(x)

{

for (i in 1:10)

{ mat=matrix(c(i,i))

print(mat)

}

}

Matrix.Gen ()

To run your own function you just type in Matrix.Gen () into your R command line. When creating a loop in R it is
important to make sure you understand how the loops are subset in your function. This is especially important when
you have more than one loop.There are two schools of thought when sub setting code one where you just make sure
you close a bracket once you open it.

Eg:

Matrix.Gen <- function(x) {

for (i in 1:10) {

mat=matrix(c(i,i))

print(mat)  }

}

I personally don’t like this method as if you lose a bracket it can get really confusing! I prefer making sure that my brackets line up and you indent the code as you introduce a loop.

Eg:

Matrix.Gen <- function(x)

        {  for (i in 1:10)
            {   mat=matrix(c(i,i))
                print(mat)
             }
        }

If you set the open and close brackets in a line then they are a lot easier to track. I also like to place my brackets under the function or for loop so you can easily link the appropriate bracket to loop.

A good use for a loop in r is creating a function that runs through your model fitting or model selection. Using a loop to do this can speed up the process of manually entering a single model at a time. The code I will display below run an all model selection method for 249 individual species. This bit of code runs two loops, often referred to as a nested loop. A nested loop is a loop within a loop and this is where you need to start taking care with your bracketing, otherwise it can get really confusing.

Import data as csv files. There are three files that will be called into this loop. Environmental data, ##Species Data and the models I want to fit

Env_AusNZ360 = read.csv ("EnvPoints10m360lon.csv)
Oph_spp = read.csv ("Spp20_Oph_AusNZ.csv")
mods = read.csv("PPM_mod_select_lin_poly.csv")

This next bit of code creates a factor R can recognize based on my species data. I do this so I can get R to call in a single species at a time. These individual species will be called in the first loop (the j loop).

Oph_spp = Oph_spp[,c(1,2,3,4,5,6,7,9,11,12)]
WhichSpp = factor(Oph_spp$Spp, exclude = NA)
classes = levels(WhichSpp)
nClasses = length(classes)
fit.ppm <- function(x)
 { for (j in 1:nClasses)
     { print(classes[j])
       dat2add <- data.frame(who = Oph_spp[,1], Oph_spp[,2:3], depth = Oph_spp[,5], Oph_spp[,6:9])
         for (i in 1:78)
          { ft.ppm0.4 =  ppm(mods[i,2], dat2add[dat2add$who==classes[j],], Env_AusNZ360, 0.5)
            mods[i,2] <- mods[i,2]
            mods[i,3] <- classes[j]
            mods[i,4] <- ft.ppm0.4$ll
          }
          print(mods)
          write.table(mods, "C:\\Possion PP\\PPMresults_Spp_10m_05scale.txt",j, sep=".", quote=F)
      }
   print("Finished")
 }

So we’re going down a level ( and if you’ve seen inception you’ll get that link) To clarify: the  i loop is nested within the j loop so It’ll run 78 models for the number of species I have. I’ve then closed the i loop and asked it so save my model results to my mods csv file within the j loop. This will mean it’ll append the result of each species as it is solved by R.

So loops can be confusing, but they can greatly speed up your outputs if you get the basics right. Another way to increase the speed of doing calculations in R is to introduce parallelization.  Most modern computers have more than one core or processor which means instead of running a single loop like the above code you can set your computer to paralleling your code. The speed you can increase your loops is based on the number of cores you have. Most modern computers have 4-6, which means if you have a large data set or something that is slow, you can increase the output speed by 4-6 times! I know what you’re thinking that sounds complicated?… In fact that sounds way above my head?… You’d have to be a computer programmer or something like that to get parallelization working? We’ll luckily in R all the hard work has been done.

All you need is two software packages that you can download with ease. I use linux for parallelization, but there are windows versions available.

For linux the packages are:

install.packages("foreach")
install.packages(“doMC”)

For windows:

install.packages("foreach")
install.packages(“doSNOW”)

Then load packages:

library(“foreach”)
library(“doSNOW”)

This tells R how many cores to use, the more cores you use the faster the loop will run, but the harder your machine will have to work.
For the purposes of this example I’m going to set it at four.

registerDoMC(cores=x)
registerDoMC(cores=4)

For windows it’s slightly different:

cl <- makeCluster(4)
registerDoSNOW(cl)

To get R to start paralleling all you need to do is convert your for loops to foreach loops:

Matrix.Gen <- function(x)
   { for (i in 1:10)
       { mat=matrix(c(i,i))
         print(mat)
        }
   }

Will become:

Matrix.Gen <- function(x)
     { foreach(i=1:10) %dopar% 
         { mat=matrix(c(i,i))
           print(mat)
          }
      }

Now the foreach call will parallelize your loop based on the number of cores you assign. This should now run 4 times faster!
The same can be done for the nested loop example above.

fit.ppm <- function(x)
   { foreach(j=1:nClasses) %dopar%
       { print(classes[j])
         dat2add <- data.frame(who = Oph_spp[,1], Oph_spp[,2:3], depth = Oph_spp[,5], Oph_spp[,6:9])
            foreach(i=1:78) %dopar%
               { ft.ppm0.4 =  ppm(mods[i,2], dat2add[dat2add$who==classes[j],], Env_AusNZ360, 0.5)
                 mods[i,2] <- mods[i,2]
                 mods[i,3] <- classes[j]
                 mods[i,4] <- ft.ppm0.4$ll
               }
          print(mods)
          write.table(mods, "C:\\Possion PP\\PPMresults_Spp_10m_05scale.txt",j, sep=".", quote=F)
        }
      print("Finished")
    }

I hope this has been useful. Looping and paralleling your code should speed up your analyses. And while your loop is running you can continue to work on other projects or enjoy a cup of tea and a Monte Carlo biscuit. Like I’m going to do now. Until next time. Skip.

Posted in Uncategorized | Tagged , , | 4 Comments

GLMs Blog Part 1.

A recent discussion on a paper I’m writing made me take a step back and ponder what do I really know about GLMs? After a few moments I realised expanding the acronym to Generalised Linear Model was about as far as I could get. So decided it was time to crack this nut.

So a GLM is made up of three key components:

  • The error structure
  • The linear predictor.
  • The link function.

A GLM allows models to incorporate a variety of different error distributions, this is really useful when dealing with data that isn’t normally distributed, such as count data (Poisson errors), presence/absence data (binomial errors) which is really useful depending on the data you have and the questions you are intending to ask.

GLM have a number of applications, but one common use is to make predictions on species distributions. GLMs relate an observed value to a predicted value. The observed values are essentially your raw data or say the environmental variables at site x, the predicted values are obtained by transforming the linear predictor. The linear predictor is the sum of the effects of one or more explanatory variables used in the model.

In the model I’ve been using I been mixing GLMs using finite mixture models, I won’t go into detail on mixing GLMs, but in my example the model is comprised of four GLMs, the below R code is a way at looking how well the models are fitting the data. I’ll be showing you how to explore an individual GLM.

An example of generalised linear model equation:

>  final.formula <- final.mod$formula

> y ~ t + tsq + s + ssq + o + osq + flux3 + flux3sq

In the above equation y (chance of observing this groups of species) is explained by the environmental covariates t = temperature, s= salinity, o = oxygen concentration and flux3 = particulate organic carbon drift to the sea floor (a measure of productivity) and there squared versions (for looking at non-linear relations of the data).

Note: you can use the poly function in R to fit polynomials to your data,

Eg: poly(t, 2) is the same at tsq above.

In essence the linear predictor is the observed values * the model coefficients. Here is an example of calculating the linear predictors across the sites used to fit the above model.

# This gives you the environmental variables for each site in my model

>  model.env.data <- model.matrix(final.formula,data=cbind(obs=1,env_data))

#  This gives the linear predictor across all these sites.

>   lpre <- model.env.data%*%final.mod$coef[1,]

To determine the fit of a given model, a GLM evaluates the linear predictor for each value of the response variable, then compares the predicted value with a transformed value of y. The transformation to be employed is specified in the link function

The link function can take a number of different forms depending on the type of error structure in the model. Classically there are four main link functions which can be used to transform y. If your data is normally distributed: identity link; poisson: log link; binomial: logit and gamma: reciprocal. In my example I’m using presence/absence data which means I have a binomial error distribution and hence I use a logit link function.

#Setting the link function

>  link.fun <- make.link(“logit”)

If you are using a function in R such as glm you can define the link function when you enter the model formula:

>   glm(y ~ t + tsq + s + ssq + o + osq + flux3 + flux3sq, family=binomial)

The size of each term in linear predictor indicates it contribution to the overall likelihood, big negative indicates low probability, big positive indicates high probability.

To get the overall log likelihood you transform the linear predictor using the link function as is shown below:

>   ll <- link.fun$linkinv(sum(lpre))

However often you want to have a look at how the environmental covariates (coefficients) are responding within the model. There are a number of ways to do this but one way that works quite well is to visualise the response. For instance if you wanted to see how temperature was responding you could look at what range of values temperature contribute positively or negatively to overall log likelihood.

Here is a little bit of code which plots the response of temperature in the above model.

>   tmp.temp <- seq(2,26,length=100)

>   t.plot <-  plot(tmp.temp,final.mod$coef[1,2]*tmp.temp+final.mod$coef[1,3]*tmp.temp^2,type=”l”,ylab=”Total contribution of Temperature to Likelihood in G1″,xlab=”Temperature”)

If everything worked correctly you should a figure such as the one below:

In this figure you can see the non-linear response of temperature and can see for temperatures greater than 20°C temperature is contributing to the overall likelihood of the model. You could potentially do this with all the environmental covariates and visualise their respective responses.

If you want to be a bit fancy you can also add in the intercept:

plot(tmp.temp,final.mod$coef[1,1]+final.mod$coef[1,2]*tmp.temp+final.mod$coef[1,3]*tmp.temp^2,type=”l”,ylab=”Total contribution of Temperature to Likelihood + Intercept”, xlab=”Temperature”)

Another potential use of the linear predictor is to check the contribution of environmental variables when using a model to make predictions across an extent. This problem first cropped up when I was getting extremely high probabilities at sites where it didn’t correlate with other the majority of high probabilities.

To assess the contributions of environmental variables at prediction sites, you can follow a similar pattern to the code above but instead of entering the environmental covariates used to fit the model you enter the environmental variables that you want to predict your model onto.

model.pred.data <- model.matrix(final.formula,data=cbind(obs=1,PrePoint))

link.fun <- make.link(“logit”)

lpre.pred <- model.pred.data%*%final.mod$coef[1,]

## log likelihood

ll <- link.fun$linkinv(lpre.pred)

This will give you the log likelihood for all the points in space. Once you have achieved this you can look at the data points that are producing abnormally high log likelihood values.

>  ll.sort <-  head(sort(ll, decreasing=TRUE))

An example in my model was site 20087 where the probability of was detection was abnormally high and not aggregated with the majority of high probability points. You can  manually look at the environmental covariates by entering the coefficient values from the model and environmental variables from site x (in this case 20087), but keeping all values except one (temperature in this case) at the mean.

Which should look something like this:

lpre.g1.20087.t <- 3522.88236315 + -0.23010015*27.21660 + 0.01096224*tsqmn + -200.04575957*smn + 2.84021577*ssqmn + -1.98680350*omn + 0.36839100*osqmn + -0.43793932*flux3mn + 0.01525628*flux3sqmn

Environmental variables at site 20087:

(Intercept)           t             tsq               s             ssq             o          osq        flux3     flux3sq

1.000            27.2166   740.743   34.421   1184.825    4.494   20.197    2.379    5.662

> lpre.g1.20087.t

[1] -5.747775

From this you can see that temperature isn’t contributing to the overall log likelihood at this site. After some detective work I found that salinity was the culprit. See below:

>  lpre.g1.20087.s <- 3522.88236315 + -0.23010015*tmn + 0.01096224*tsqmn + -200.04575957*34.4212 + 2.84021577*ssqmn + -1.98680350*omn + 0.36839100*osqmn + -0.43793932*flux3mn + 0.01525628*flux3sqmn

> lpre.g1.20087.s

[1] 79.23035

Going back to those nifty graphs above:

tmp.sal <- seq(34,36,length=100)

>  plot(tmp.sal,final.mod$coef[1,4]*tmp.sal+final.mod$coef[1,5]*tmp.sal^2, type=”l”,ylab=”Total contribution of Salinity to Likelihood in G1″,xlab=”Salinity”)

You can see that the values for salinity at 34.4 are contributing highly to the likelihood of the overall model and could account for the really high probability at this site. With some further investigation I found that the environmental covariate values sat outside the bounds of my model space. This is a problematic issue as you can’t estimate a relationship where you don’t have any data. So the best thing to do in this situation is to remove these points from my prediction space. Once I clipped the sites with environmental variables outside the sites used to fit my initial model things started looking good.

Well that’s my first GLM blog. I hope that it makes sense and doesn’t raise to many questions. I’d love some further advice on dealing with GLMs in R so feel free to post a comment or two. Cheers Skip.

Posted in Uncategorized | Tagged , | Leave a comment

So it’s early days, PhD is underway and I’m overrun with reading, R code and loving it. In fact I’m almost Imageas happy as the guy in that retro wetsuit about to catch a few barrels.

I’m going to keep this first post short, but I was sent a really cool video of a scaleworm (a family of polycheates I did my masters research on) living commensally with a keyhole limpet. The two make a great underwater Batman and Robin, with the scaleworm coming to the rescue, as a good sidekick should! Enjoy

Posted on by skiptoniam | 1 Comment